Channel analytics offer more numbers than any team can use, which is why reporting so often becomes a screenshot exercise. Disciplined youtube analytics reporting narrows to a handful of measures and asks the same questions of them every period.
Choose metrics that inform a decision
For each metric you report, name the decision it could change. Views rarely change anything on their own. Average view duration, the share of viewers still watching after the first minute, and where traffic came from all point at specific, fixable things.
Watch time and retention deserve priority because they describe whether the video worked for the people who arrived. Impressions and click-through describe whether the packaging worked. Confusing the two leads to redesigning thumbnails when the problem is in the first thirty seconds.
The routine
- Fix the metric set and keep it, including in bad months.
- Use identical window lengths so periods are comparable.
- Report per-video figures alongside channel totals.
- Always pair a click-through figure with a retention figure.
- Note traffic sources; a shift there explains many sudden changes.
- Write two sentences of interpretation per notable movement.
- Close with decisions and owners for the next period.
Beware the recommendation swing
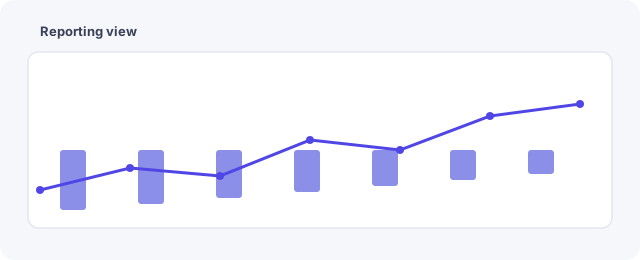
A single video picked up by recommendation can dominate a month and make everything else look like a decline. Report that explicitly rather than letting it distort the trend, and where possible show the period with and without the outlier.
Video performance also accumulates over a long tail, so judging an upload after four days measures novelty rather than value. Allow four weeks before drawing conclusions about anything except an obvious technical failure. The stakeholder-facing summary is in the monthly performance report, and deeper diagnosis in the retention analysis guide.
Common questions
How often should analytics be reviewed?
Weekly by the team for operational signals, monthly for anything reported upward.
Is click-through rate a target?
Not on its own. Raising it by overstating the content lowers retention, which costs more than the extra clicks return.
Should every video be analysed?
Analyse the outliers in both directions and sample the rest. Analysing everything equally produces volume, not insight.
What about comparing to other channels?
Published benchmarks vary so widely they rarely help. Your own history is the fair comparison. See contact.
What should be reported when a video fails?
Say where viewers left and what was happening at that point. A failure located precisely is a lesson, while a failure reported as a low view count is only discouraging.
Who should read the analytics review?
The people making the next video. Reports that travel upward without reaching the production team change nothing about what gets made.
How far back should comparisons go?
Far enough to cover a full production cycle. Comparing two weeks against two weeks mostly compares which videos happened to land in each.
Related guides
More on this topic from the same section: