Retention is the most diagnostic chart available and the least used, because it takes effort to read and often says something unwelcome. A habit of youtube retention analysis turns that discomfort into specific, fixable notes for the next edit.
The first minute decides most of it
Nearly every video loses its largest share of viewers in the opening seconds. That is normal, but the size of the drop is controllable, and it is where the highest-value editing decisions live.
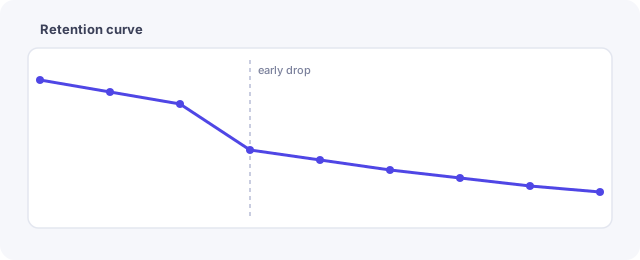
Common causes are a slow start, a promise restated at length before anything happens, or an opening that does not match what the title implied. All three are fixable in the edit, and all three are visible as a steep early cliff rather than a gentle decline.
Reading the curve
- Steep early cliff: the opening does not deliver on the title.
- Sharp mid-video drop: usually a specific moment — check what happens there.
- Gentle decline throughout: normal; compare against your own other videos.
- A rise: something was worth rewinding, and is worth understanding.
- Flat then cliff at the end: outro is longer than anyone wants.
- Compare like with like — length and format change the shape.
Always watch the moment where a drop occurs rather than theorising about it. The cause is frequently mundane: a long transition, an unclear diagram, or a tangent that lost the thread.
Fix the pattern, not the video
A published video rarely justifies re-editing. The value of retention analysis lies in what it changes about the next one, so record the finding as a note for production rather than as a repair job.
Look for repetition across several videos. One bad drop is an anecdote; the same drop shape three times is a habit — a routine slow opening, an over-long recap, a standard outro nobody watches. Those are worth changing permanently. Related work sits in the video scripting workflow and the analytics reporting workflow.
Common questions
What is a good retention figure?
There is no universal number; it varies with length and subject. Your own comparable videos are the only fair benchmark.
Do longer videos always retain worse?
In percentage terms usually, in total watch time often better. Read both before concluding anything.
Should intros be removed entirely?
Branded intro sequences are frequently a pure cost. If the curve drops through yours, it is not earning its place.
How soon can retention be read?
Within a few days the shape is usually stable, even though totals keep growing. See the FAQ.
Should retention be compared across channels?
No. Subject, length and audience differ too much for the comparison to mean anything, and published averages are gathered from wildly mixed samples.
Related guides
More on this topic from the same section: