Page reports frequently list numbers nobody uses. A useful facebook page reporting structure reports the few measures that reflect whether the page is doing its job, and says what changes as a result.
Report what the page is for
If the page mainly serves customers, then response time, message volume and review sentiment matter more than reach. Reporting reach on a service-oriented page produces a document that looks like marketing and describes nothing anyone acts on.
Decide what the page is for, then choose the metrics. That order matters, and reversing it is why so many reports measure whatever was easiest to export.
The structure
- Summary: three sentences — what happened, why, what changes.
- Response time and message volume.
- Reach and engagement, over an identical window each month.
- Reviews or recommendations received, and how they were handled.
- Published versus planned.
- Notable posts, with one sentence each.
- Decisions for next month, with owners.
- Limitations: what these numbers cannot show.
Response time deserves a prominent place. It is visible to visitors, directly affects whether people message, and is entirely within the team's control.
Keep the window fixed
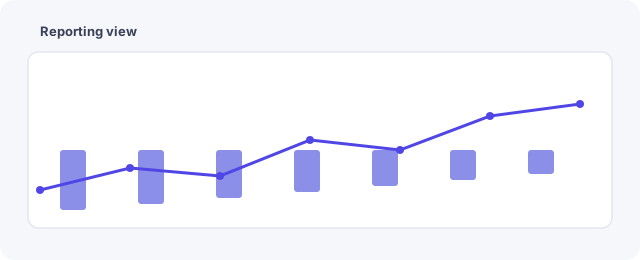
Use the same length of period every month. Mixing "last month" with "since the campaign" makes comparison impossible and is the most common way reports become quietly persuasive rather than informative.
Write commentary rather than captions. Two sentences explaining why a figure moved is worth more than another chart, and where the cause is unknown, saying so plainly protects the report's credibility. Related structure sits in the page content workflow and the page audit checklist.
Common questions
How long should the report be?
One page. Detail belongs in an appendix for anyone who asks.
Should paid and organic be combined?
No. Combined figures hide which effort produced which result, and they respond to entirely different decisions.
Is reach a useful measure?
Only alongside something showing whether the reach mattered. Reach alone rarely changes a decision.
Should reviews be included?
Yes, with how they were handled. They are frequently the first thing a prospective customer reads.
Who should receive the report?
People who make decisions about the page. Wide distribution encourages defensive writing. See the services page.
How much history should the report show?
Three to six periods. A single month in isolation almost always reads as either a triumph or a crisis, and neither is usually accurate.
Should the report include competitor pages?
Only what is publicly visible and only if it changes a decision. Estimated competitor figures presented as data are worse than no comparison at all.
What belongs in the limitations section?
Anything the figures cannot show — offline enquiries, word of mouth, or a month distorted by one unusual post. Stating it once prevents a reader over-reading a small movement.
Related guides
More on this topic from the same section: